Choose Wisely: Understand your personal style for smarter decision making
From the front lines to the C-suite, every employee makes decisions. While decisions can be strategic and long-term, most are tactical in nature, occur daily, and are made fairly quickly. How do your employees make decisions? Are they data hounds—not content until they’ve analyzed every possible scenario? Do they make snap decisions based on gut and emotion? Either way, superior decision-making skills are attainable via a simple and effective framework, called the 3D Decision Support System.
“At this very moment, there’s an odds-on chance that someone in your organization is making a poor decision on the basis of information that was enormously expensive to collect.” Such is the conclusion of “Good Data Won’t Guarantee Good Decisions,” a 2012 report in The Harvard Business Review. Of course, many organizations use the usual checklists, toll-gate reviews, and sign-off approvals to help ensure good decisions. But what about the day-to-day decisions being made without such scrutiny? Perhaps it’s time for a new perspective on decision-making styles and their impact on business.
 SOME CONTEXT
Businesses are awash in data. In fact, most are collecting more data than they know what to do with. According to APICS’s “Big Data Insights and Innovations” report, 53 percent of respondents either have too much trivial data but not enough useful data or have high-level data but not enough to make detailed decisions. For all the promise of big data, until we can get organizations consistently incorporating data into decision making processes, we won’t realize the returns. Data-driven, analytic-savvy businesses make the best decisions, big and small, every day. So how do we create more analytic-savvy workers who can analyze, make sense of, and drive the effective use of data?
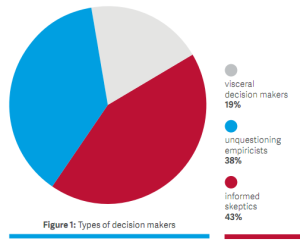
In 2012, the Corporate Executive Board (CEB) surveyed 5,000 employees at 22 organizations to assess their ability to find and analyze relevant information. In the results, the employees were sorted into three groups. (See Figure 1.) Visceral decision makers—the smallest group—exclusively use intuition, seldom trusting analysis. They tend to make decisions unilaterally. On the other hand, unquestioning empiricists rely extensively on analysis and tend to trust analysis over judgment. These purists follow logic and value consensus.
Informed skeptics balance judgment and analysis—and comprise the largest number of respondents. They possess strong analytical skills and listen to others’ opinions while being willing to dissent. They bring proper context and analysis to produce real insights. Informed skeptics are the best equipped to make good decisions and are the kind of analytic-savvy workers every organization should try to cultivate. The CEB study showed that functions whose employees had the highest average scores in this category performed about 24 percent better than other functions across a variety of metrics, including effectiveness, productivity, employee engagement, and market- share growth.
Consider the following real-world examples: Aaron Rents and Netflix both are in hyper-competitive businesses with razor-thin margins. Ever wonder why Aaron Rents—an industry leader in the affordable, rent-to-own home furniture market for low-income consumers—has one of the lowest default rates in the industry? Despite the fact that most of its customers are living paycheck-to-paycheck, Aaron Rents’ write-offs for bad debt were only 2.5 percent in 2012. Turns out company leaders have learned that references are a better predictor of creditworthiness than traditional
credit checks or even proof of employment.
Internet streaming leader Netflix has 40 million subscribers and is incredibly successful at selecting the movies and television shows its customers enjoy. This is because, at its heart, Netflix is a data-driven company. The business tracks a host of metrics: the type of content; the completion rate of television series; when customers use pause, rewind, or fast forward; what day and time content is watched; what device is used; ratings given (about 4 billion per day); searches (about 3 million per day); browsing and scrolling behavior; and more. Netflix creates personalized algorithms from this data and offers viewing recommendations that accurately predict what people will watch next. Through its analytics, Netflix even knows how much content a user needs to watch in order to be less likely to cancel.
THE FRAMEWORK
Following is an explanation of the 3D Decision Support System framework for excellent decision making. The Ds stand for defining, designing, and deciding.
Defining. Albert Einstein is quoted as having said, “If I had only one hour to save the world, I would spend 55 minutes defining the problem, and only 5 minutes finding the solution.” In other words, before jumping into solving a problem, we should step back and invest time and effort understanding it. The implications are significant because the problem statement shapes the solutions. For example, a problem that is defined as a technology issue is likely to be assigned an IT solution. Similarly, if a problem seems to be a people issue, the solution likely will be related to training or staffing.
In order to effectively identify issues, first answer the following questions:
- What is occurring?
- Where in the process or product does it occur?
- When in the process does it occur?
- Who does the problem affect?
- What’s the universe of impact (the magnitude of the problem in terms of events)?
- What ’s the cost of doing nothing?
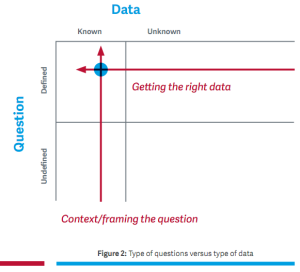 In responding to these questions, you’re providing context—and data means nothing without context. The idea is to frame the problem in terms of asking well defined questions with known data. The intersection of these two attributes is the quadrant that generally provides the most insights and clarity. (See Figure 2.)
Once you’ve answered these questions, write the problem statement in this simple format: During [period of time], the [process being reviewed] within [area of the business] has not met its goal of [X]. This poor performance is resulting in [description of problems or issues], which are costing the business [estimated impact in dollars or other metrics] per year.
Designing. The design phase of the 3D Decision Support System involves forming a hypothesis.
Looking at statistics can be very worthwhile here. The most useful statistics are persistent and predictive. Persistent statistics show that the outcome of an action at one time will be similar to the outcome of the same action at another time. Those statistics are dominated by skill and strong processes and reflect performance that an organization can reliably control through the application of skill. Predictive statistics link inputs with outputs or cause and effect. They
predict the outcome being measured.
Deciding. Making decisions, step three, is challenging even when problems are clearly defined and the right data is being applied. However, risk and uncertainty make determining the best course of action even more complicated. Note that these two factors often are confused with one another. When this occurs, there’s a tendency to spend too much time studying the problem, which leads to the “analysis paralysis” phenomenon.
It’s thus important to understand that risk is relatively linear and quantifiable. It is most commonly associated with dollar loss. The greater the potential financial impact, the greater the risk. Uncertainty is nonlinear and difficult to measure. When the probability of an event is very low, uncertainty is likewise very low.
FINAL TIPS
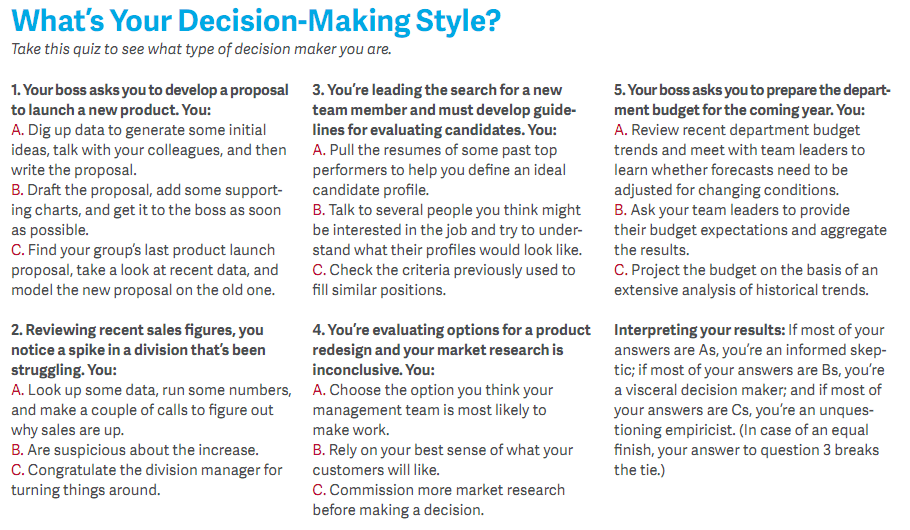
There are several proven guiding principles of sound decision making. First, know your decision-making style. Are you a visceral decision maker, an unquestioning empiricist, or an informed skeptic? Also recognize these characteristics in the people with whom you interact. Always keep in mind that context matters. Let’s face it, a pile of numbers is just that—a pile. Without context and analysis, there is no meaning.
But if we take this pile, give it context, and analyze what it means, then we gain knowledge. Knowledge produces insights.
Always challenge conventional wisdom. Look at how your organization measures its performance. Are the metrics internally oriented or from the customer perspective? If your department consistently beats its key performance indicators, does this mean you’re that good or the goal is too easy? And finally, fail fast and cheap. Failure should not be put in a negative light. Experimentation is a good thing. To grow professionally or as an organization, we need to quickly learn what works and what doesn’t.
By Peter J. Sherman, CSCP
 Peter is a partner with Riverwood Associates in Atlanta, Georgia. He leads the Lean Six Sigma Programs, which involves certification training, project coaching, and consulting. Prior to forming Riverwood Associates, Sherman was director of process excellence at Cbeyond Communications. He also served as lead instructor for Emory University’s Six Sigma Certificate Program from 2007 to 2011 and is a certified lean six sigma master black belt.
Click here to email Peter or connect on LinkedIn


