The Myth of Japanese Companies and Management
It seems that at every Conference, Symposium, or other gathering of higher-learning and thought-leaders – where the topic is Lean Six-Sigma – many of the attendees, and almost all of the speakers, glorify and hold with the highest veneration the supposedly unmatched performance and prowess of Japanese companies and their management. Enshrined as proof-positive in the most revered of holy scrolls is the Toyota Production System – the supposed map to the Promised Land. And when followers of this most sacred scripture speak, they declare with such thunderous aplomb the virtues of all things Japanese and cast aside as heathens the non-believers.
However, when I attend similar gatherings at locations around the world where the audience is business leaders and the topic is business strategy and finance (such as: events organized by the Association for Corporate Growth, Symposiums for Private Equity and Finance, various Economic Forums and Congresses, and Conferences on Business Strategy, etc.), there is never any mention of any Japanese companies nor reference to their styles of management.
This has always given me cause for pause. How can something that is supposedly an absolute truism and necessity for success in one circle be almost completely ignored in another; especially when both circles purportedly share the same aspiration – business performance and accelerating success?
This has bothered me for some time.
And after careful consideration and investigation (knowing full-well that a contrarian position will cast me as a heretic and draw a lot of fire and resistance), I believe this reverence of Japan and Japanese companies is largely (perhaps entirely) undeserved – possibly even a myth. As they say, sacred cows make the best hamburger. And even if all this hype about Japan and Japanese companies was ever true at some point in the past, it is certainly not true today – and has not been true since the early 1990’s. Further, I would propose that the expected results of any company that has “drank the Kool-Aid” and is trying to emulate the way a Japanese company operates as a path to a better future are misguided at best, and more than likely greatly exaggerated – leading to a disappointment that is almost certainly inevitable.
This is not to say that the tools and techniques of the Toyota Production System and Lean Six-Sigma do not deliver positive results or otherwise drive value in an organization, they certainly do under the right circumstances. But today, the use of these tools and techniques are now ubiquitous across companies – and since they are nearly universally accepted and embraced by companies, they no longer offer themselves as a differentiator nor do they offer a competitive advantage as they once did. And as such, they expose the limitations of the Japanese way of running a business.
But business people are data-driven, so let’s examine some data.
For your consideration, we are going to examine several economic and business indicators from two time-periods: 1980 through 1992, and 1992 through 2015.
The first period being 1980 to 1992 when Japan was undeniably the envy of the world with its economic prowess and productivity – the culmination of decades of evolving and quantifying the way Japanese businesses ran with the then-leadership of Toyota (Sakichi, Kiichiro, and Eiji Toyoda, along with Taiichi Ohno) and W. Edwards Deming at the forefront. This was the period of time when the Japanese and Japanese companies were buying everything they could (including, for example, Rockefeller Center in Manhattan).
It is important to keep in mind that this is the same period of time when the team of James Womack, Daniel Jones, and Daniel Roos at Massachusetts Institute of Technology (MIT) wrote the book “The Machine that Changed the World” (1990) which put Japanese companies (specifically Toyota) and the Japanese style of management on a pedestal – and also introduced the term “Lean Manufacturing” into the lexicon of business management. It is during this period – the assent of Japanese business as compared to that in the United States at the time – when the reverence of the Japanese management methods began.
And the Second Period being the years from 1992 to 2014 (a period of 22 years) – a period of time in Japan that is referred to as the “lost decade” – which turned into two, and now going on three.
Macro View – Comparing Countries
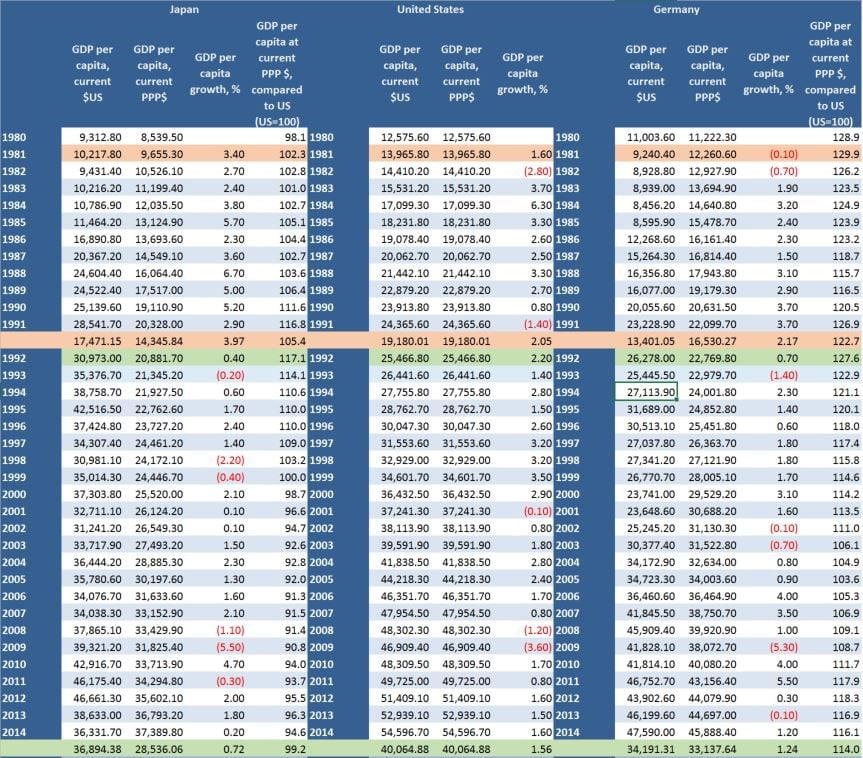
To start; let’s compare the Gross Domestic Product (GDP) of Japan, Germany, and the United States (see Figure-1 below) for the two periods. All figures are Per-Capita (PC), equalized against the United States Dollar, and adjusted for Purchasing Power Parity (PPP) – this is done so that a comparison of “apples to apples” can be made, with other variables equalized.
One would think that, if Japanese companies outperformed that of others, especially those in the United States as some would have you believe, then the economy of Japan would also outperform that of the United States.
Source of Data: The World Bank and International Monetary Fund
Table Generated by: KNOEMA at www.KNOEMA.COM
In the period from 1981 to 1992, the Per-Capita Gross Domestic Product (PC-GDP) of Japan grew an average of 3.97% and for Germany the PC-GDP grew at an average of 2.17% – both of which outpaced the average PC-GDP of the United States, which was 2.05% (still a respectable rate of growth for a large and mature economy). But the rate of growth in the PC-GDP of Japan during this period was almost twice that of the United States.
However, if we look at the period from 1992 to 2014, the average growth of PC-GDP in Japan was only 0.72% (less than 20% of its previous growth rate) and 1.24% in Germany – versus an average PC-GDP growth rate of 1.56% in the United States. Over this second period lasting 22 years, the average PC-GDP growth rate in the United States was over twice that of Japan.
As such, I do not believe that it can be reasonably argued that Japan as a country has outperformed the United States for some considerable amount of time and – according to the International Monetary Fund forecasts – there is no indication of this trend changing anytime soon.

Peer Group; Comparing Industrial Indices
But that is the performance of a country. Let’s examine the performance of the companies within the country compared over the similar periods. The simplest, and arguably most accurate way of comparing company performance is the value of their shares. After all, this is a reflection of how much value an investor perceives that a company has. An aggregate of values from a cross-section of major companies within a country can be found in the major stock market indexes of that country.
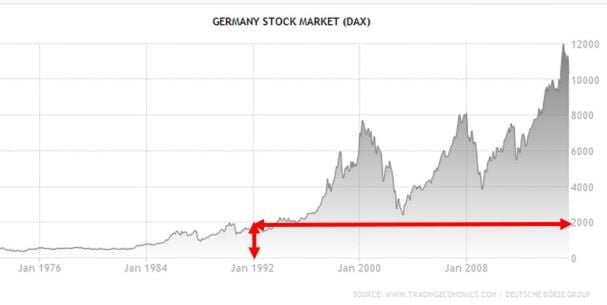
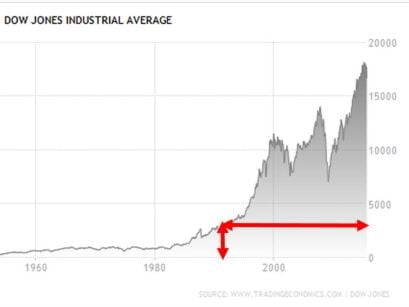
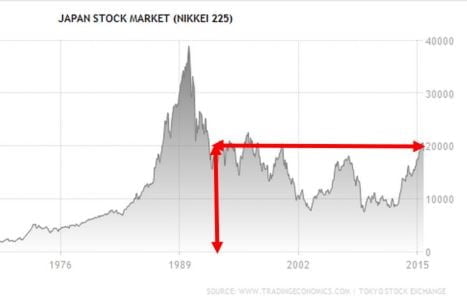
As with the comparisons of PC-GDP above, we will compare the main stock market indexes of Germany (DAX, Figure-2), the United States (DJIA, Figure-3), and Japan (Nikkei, Figure-4).
The Deutscher Aktienindex (DAX)
Prior to 1992, we can clearly see the growth in value of the companies that comprise the German DAX (see Figure-2 below) was unremarkable; with some volatility in the late 1980’s which would see the index double, then halve, then double again within a period of seven (7) years. Even considering the challenges and emotion of German Reunification (a transformational event for Germany and the German people) which occurred in 1990, the behavior of the DAX was rather unremarkable.
However, between 1992 and August of 2015, we can see the value of the DAX increased from approximately €2,000 to approximately €11,500 – an increase of 575%. The two “dips” represent the Recession of 2001 and the Financial Crisis of 2007-2008. In each case, the Recession and Recovery Cycle took the form of the classic “V”, sharp drop followed by a sharp recovery. And this latest recovery has also had to endure the uncertainty brought about by the Euro-Crisis – which also took the form of the classic “V” in 2010.
The Dow Jones Industrial Average (DJIA)
Similar to Germany and prior to 1992 in the United States, we can clearly see the growth in value of the companies that comprise the DJIA (see Figure-3 below) was also rather flat and unremarkable (though less volatile than the German DAX). And also like Germany and the DAX, we can see an accelerated upward trend starting in 1984.
However, between 1992 and August of 2015, we can see the value of the DJIA increased from approximately $3,500 to approximately $17,500 – an increase of 500%. The two “dips” in the DJIA also represent the Recession of 2001 and the Financial Crisis of 2008. And, like in Germany, the Recession and Recovery Cycle took the form of the classic “V”.
The Nikkei
Unlike both the United States and Germany, the Japanese companies that comprise the Nikkei index (see Figure-4 below) enjoyed a considerable and accelerated rate of growth in value in the run-up from 1972 to 1992, going from a value of approximately Y4,000 in 1976 to a high of almost Y40,000 in 1991 (a 1,000% increase in a span of 15 years) and from nearly Y10,000 to Y40,000 during our comparison period (an increase of 400%).
The decline in the value of Japanese companies from 1991 to 1993 started to follow the classic “V” with a classic “down-stroke” when the Nikkei dropped 50% from nearly Y40,000 to Y20,000 – but unlike the recessions endured by Germany and the United Stated, there was never any “recovery” in the economy as would be indicated by an “up-stroke” in a classic “V”. Instead, what we find is a more gradual sinking with small and short-lived “dead-cat bounces” until reaching Y10,000 in 2003.
This was followed by a short-lived and modest recovery when, like almost all other G-20 economies, the Nikkei enjoyed a bit of a run-up to Y20,000 in 2007, but declining again to Y10,000 during the Financial Crisis and remaining in this trough for several years – far longer than any of its peers. From 2013 and with the introduction of “Abenomics”, Nikkei is once again recovering, but this is not to do so much with company performance as the macro-economic moves of the Japanese Government and coordinated with the Bank of Japan.
The bottom-line; the value of the companies which comprise the Nikkei in 1992 was the same as in 2015 – twenty-three years. And most of that time, their value was considerably less. In fact, for a third of that time (7yrs), the Nikkei was half the value it was in either 1992 or 2015. I can’t imagine a CEO of a company in the States promising that the value of the company he leads will be the same in twenty-three years as it is today and remain in the position very long. And I find it impossible to imagine that people might hold Japanese companies, and their leadership and approaches to management, in as apparently high esteem as they do when the numbers don’t support such reverence at all.
But there is something even more interesting to consider; the value of the Japanese Yen versus the United States Dollar (see Figure-5 below) – and how these two variables (value of the Yen versus the Dollar and the value of the companies on the Nikkei) interplay with one another.
The value of the Yen against the Dollar held reasonably steady from 1974 to 1986 at approximately Y250 to the $1.00. But in 1986, the value of the Yen abruptly rose against the Dollar until it reached Y140 to the $1.00 in 1992 before continuing its rise to Y80 to the $1.00 in 1995.
Therefore, much of the run-up of the value of the companies that comprise the Nikkei until 1985-1988 was not due to some prowess in performance, but actually a reflection of the amplification effect of an increase in the value of the Yen from Y250 to the $1.00 to Y175 to the $1.00. Remember, the Nikkei is valued in Yen, so the values of the companies didn’t change as much as it was the value of the Yen that changed.
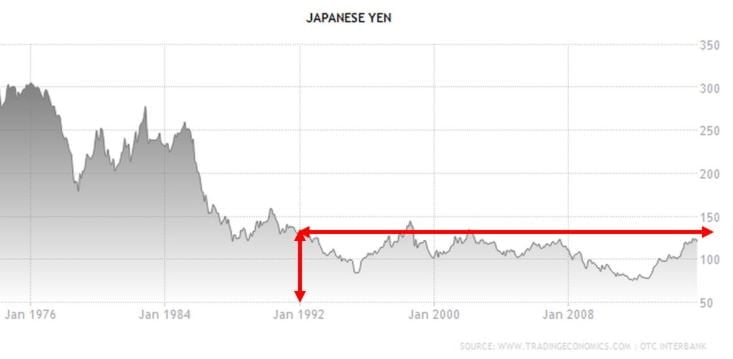
The take-away; i) the perceived run-up in value of the companies that comprised the Nikkei was amplified as a result of the dramatic increase in the value of the Yen to the Dollar, ii) the run-up of the Nikkei from all causes was relatively short lived (10 years/1982-1992), iii) the fall and subsequent trough has so far lasted 23 years, iv) the value of the companies that comprise the Nikkei today is the same today as it was 23 years ago.
These are not companies I would want to emulate – these Japanese companies with their Japanese style of leadership and Japanese way of being run. I wonder how the myth perpetuates still today
Another point to consider; Japan is a very insular society – not easily integrating non-Japanese into their country. And their companies are an exaggeration of this being insular. But interestingly, over the past several years, several non-Japanese have been hired to lead some of the biggest Japanese companies (something that would have been unheard of 20 years ago) including: Craig Naylor (Nippon Sheet Glass Company), Stuart Chambers (also Nippon Sheet Glass Company and Craig Naylor’s predecessor), Carlos Ghosn (Nissan Motors Company and then Renault-Nissan after a merger), Luo Yiwen (Laox), Brian Prince (Aozora Bank), Eva Chen (Trend Micro), Michael Woodford (Olympus), Howard Stringer (Sony) – and there are many more foreigners who are in “wingman” roles.
I wonder what statement that makes with regards to the Japanese style of management.
Specific Example – The Single Company
Thus far, we have taken a macro-level view of global economics and comparing some of the top performing economies in the world today and contrasting these economies with one another, then we examined the aggregate performance of the companies within these countries which comprise the primary stock market indices. And in each case, Japan and Japanese companies fared poorly when compared to their peers in the United States and in Germany.
But what about a single company? Can a single Japanese company be an outlier performer among its domestic peers? How does it compare to peers in other countries?
For your consideration and since it is at the epicenter of the Continuous Improvement discussion, we will examine the stock price of Toyota Motor Corporation (see Figure-6 below).
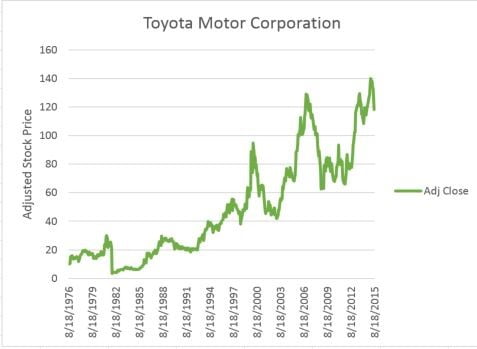
We can see that from 1976 to 1981, the share price of Toyota almost doubled, and this is keeping in line with the Nikkei. So during this period, Toyota was not an outlier in performance compared to its Japanese peers with regards to company performance (at least as measured by the price of its shares). And the Nikkei and the DJIA both doubled during this same period, so we cannot say that the companies whose aggregate value comprise the Nikkei outperformed the increase in value of the companies whose aggregate value comprise the DJIA.
However, in 1981 we see a sharp decline in the share price of Toyota from $30 per share in July of 1981, to $4 per share in September of 1981 (I could not discover why this occurred while writing this article). This precipitous drop at this time is not shared by the peers of Toyota on the Nikkei. However, from this point in 1981 to 1992, the shares of Toyota did remain nearly lock-step with the rest of the companies on the Nikkei – with Toyota climbing from $5 per share to $20 per share and the Nikkei climbing from nearly Y10,000 to nearly Y40,000 (both a gain of 400% over nine years). So during this period, Toyota compared well with its peers, but was not an outlier to the upside or downside.
In 1988, Toyota recognized the significance of the increasing globalization of the world economy and made the decision to manufacture some of its products closer to the consumer. Since the Camry was one of the best-selling models in North America, Toyota decided to build its first production plant in Georgetown, Kentucky, where it would build the Toyota Camry for the model year 1989. For this first year, the engines for the Kentucky Camry’s would come from Japan, but an engine manufacturing plant was added to the facility in 1990.
In 1999, Toyota listed on both the New York Stock Exchange (NYSE) and London Stock Exchange. As we can see from the charts; from this point forward, the value of Toyota shares appear to disconnect from the Nikkei and started to trend towards the DJIA. But a closer examination shows this is not quite the case – especially if we compare to an American peer. In this case, we will compare to Ford Motor Company (see Figure-7 below) as Ford is the only American automobile manufacturer that was continuously publicly traded during the period.
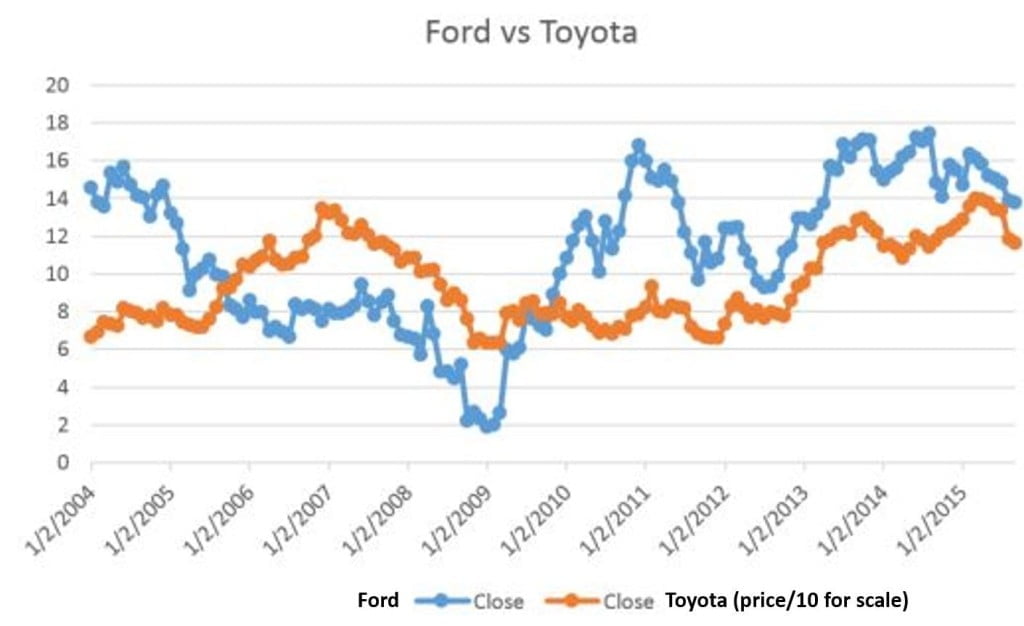
* Share-Price of Toyota is divided by 10 to actual for scale
Source; NYSE
As the charts clearly show, from 2004 to 2007, the value of Toyota was appreciated by the markets more than Ford. When the Financial Crisis began in 2007, we can see the markets begin to look unfavorably on both Toyota and Ford at the same rate – that is, until 2011 when Ford recovered in the classic “V” shape, and the value of Toyota stayed flat, following the Nikkei more than the DJIA.
It wasn’t until 2013 (with the net positive influence of Abenomics) that Toyota began trending with Ford. And, as long as Abenomics continues (which is no guarantee), the value of Toyota will benefit. But can we say from this chart that Toyota is a better managed company than Ford, or better performing company than Ford, over the last decade? I don’t see it, and the data doesn’t support it.
Lean Six-Sigma is Not Nearly Enough
As I stated early in this article, the Toyota Production System, Lean and Six-Sigma have played a significant role in bringing companies to a higher level of performance – and those early adopters certainly realized rewards. But today, most companies have recognized their benefits and have incorporated the tools and methodologies as a cornerstone of their own Continuous Improvement programs. And if everyone is doing it (not just Lean Six-Sigma, but whatever it might be), it’s no longer a differentiator and it no longer drives a competitive advantage.
Unless you are in a business or industry that is commoditized – and with businesses that deal in commodities, the only differentiator is price – then, to survive and thrive, the business needs to bring its level of performance to a higher level, strive for innovation, and increase its value-proposition to the customer. And a business needs to be more bold and decisive as it does this – two attributes which are not inherent traits embraced by the Japanese style of management.
So today; the company that optimizes its processes – but not does not take the time to balance these processes so that they work harmoniously with its systems – is not at any particular advantage. The company that focuses on cutting waste over innovation and driving value to the customer – innovation and value for which the customer is willing to pay a premium – is not at any particular advantage. Today, I would argue that the company that:
- Understands their capacity, capabilities, and weaknesses more thoroughly than their competitors,
- Recognizes an opportunity or threat more quickly than their competitors,
- Formulates an effective response more quickly than their competitors,
- Makes the go/no-go decision more quickly than their competitors,
- Deploys that response more quickly than their competitors,
- Reacts to the fluidity of engaging more quickly than their competitors,
… Has the advantage.
Today, the differentiator is the speed and precision of Decision-Making (often from imperfect data), Strategy Execution, and Operational Excellence. And, in mastering these disciplines, American Companies have the advantage over their foreign peers – due in no small part to the corporate culture and spirit of American companies. And this is reflected in their comparative value.
And those companies that do not master these disciplines and skills – wherever they may be located – are punished by the markets. And as well they should be.
By Joseph F Paris Jr

Joseph Paris is an entrepreneur with extensive international experience. He is the Chairman of the XONITEK Group of Companies, an international management consultancy firm he founded in 1985; and the Founder of the Operational Excellence Society, a “Think Tank” dedicated to serving those interested in the disciplines of Operational Excellence. In addition, Paris serves on the Advisory Board of the System Science and Industrial Engineering Department at Binghamton University and on the Process Industries Division at the IIE. He is also on the Editorial Board of the Lean Management Journal and a sought-after speaker, guest lecturer and writer.
Connect with Paris on LinkedIn


