OEE: The Most Misused and Abused Indicator
The concept of Overall Equipment Effectiveness was first written about in 1989 from a book called TPM Development Program – Implementing Total Productive Maintenance, edited by Seiichi Nakajima from the Japan Institute of Plant Maintenance. This was translated from the Japanese book TPM tenkai published in 1982.
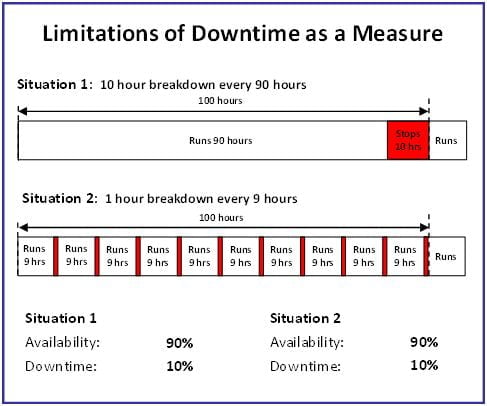
Prior to Overall Equipment Effectiveness, people monitored equipment performance through Availability or Downtime. This was fine until it was realised that you could have the same downtime for the same piece of equipment over different timeframes, yet get different output.

For example, if a lines performance is measured over 100 hours during which time it has one breakdown for 10 hours, the Availability will be 90% and Downtime 10%. If the same line over another 100 hours had 10 breakdowns of one hour duration (total of 10 hours), then the Availability would still be 90% and Downtime 10%.
However, when comparing output in the majority of cases, the first situation of only one breakdown will produce significantly more output than the situation of 10 breakdowns. The logic is quite simple. Every time your plant stops unexpectedly, there is a high probability you will have some form of quality loss from restarting to first time quality and purging; and sometimes the material being processed again will need to be reworked to complete it or be scrapped. Also, when you start back up again, there is a high probability there will be a speed loss as you ramp the plant back up to full speed.
This is why OEE was developed. It was the first time you could measure how effective your equipment was at producing good output with minimum losses.
Nakajima wrote: Effectiveness can be measured using the formula:
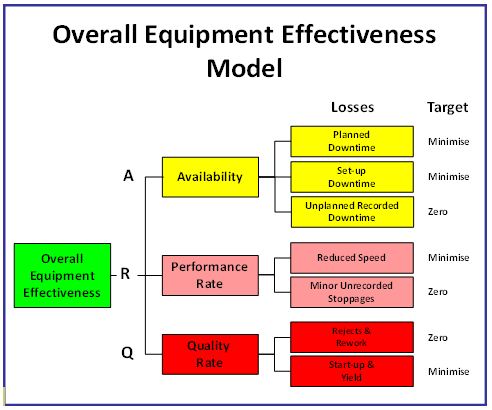
Overall Equipment Effectiveness = Availability x Performance rate x Quality rate
With the losses impacting on Overall Equipment Effectiveness listed as:
| Availability | Performance Rate | Quality Rate |
|---|---|---|
| – Breakdown losses – Setup and adjustment losses – Others | – Idling and minor stoppage losses – Reduced speed losses | – Quality defect and rework losses – Startup losses |
In more recent literature, the OEE loss model has been expanded to include Planned Downtime under Availability.

Where has it gone wrong?
Speed Losses is a good starting point. This is the loss that many people now get very wrong.
Nakajima explained speed loss by stating: ‘Bring actual operation speed up to design speed; then make improvement to surpass design speed’. He then goes on to refer to ideal speed or ideal cycle time.
In further publications from the Japan Institute of Plant Maintenance (e.g. TPM in Process Industries by Tokutaro Suzuki) we have found reference to Standard Rate. However, when looked at closely the meaning is: ‘the standard production rate is equivalent to a plant’s design capacity and is the intrinsic (inherent or real) capacity of a particular plant’.
So rather than identifying the true ideal (or theoretical) speed of a line, many companies, and consultants for that matter, use standard or budgeted speed for their calculations rather than recognising that the aim of OEE is to assist sites in achieving world class performance rather than supporting average to standard performance.
As such, we have developed 3 definitions for Ideal Speed which we find assists sites in setting the target for speed loss to a world class standard:
- Original Equipment Manufacturer’s Design Constraint Speed which we define as the maximum speed that the equipment could run at due to the limitations of its design. (This is quite different from Manufacturers recommended speed which is often slower); or
- Sampled speed measured over a short period of time (e.g. 10 minutes), achievable with best operator, best feed, best environmental conditions and best equipment conditions without “red lining” the equipment; or
- Upper Control Limit of the daily or weekly run chart of the actual equipment speed over at least 15 points with any special causes removed.
The key learning about Speed or Rate for the OEE calculation has been:
Do not confuse ideal speed (designed to assist improvement) with rate used for costing or scheduling.
For example, when scheduling you need a rate to allow the production planner to make realistic promise commitments to customers. This is often referred to as budget rate, standard rate or sometimes master production schedule rate. This rate has allowances built in for losses such as set-up time, labour inefficiencies, past poor practices, etc., to ensure promises to customers will be achieved (e.g. demonstrated rate).
We have seen many examples where the best demonstrated rate (e.g. best 5 shifts for the year) has been initially used only to cause heartache when the figure significantly improves, resulting in performance rates of above 100%, or adjustments to the best demonstrated rate such that the OEE drops. This can be even more detrimental when there is some incentive linked to OEE performance (another bad practice by companies we come across).
What is the real purpose of OEE?
OEE was developed as a ‘driver’ for improvement, not as a performance measure to be compared or benchmarked between equipment and sites.
It was also developed to provide everyone a simple indicator to monitor the amount of formal continuous improvement time that can be allocated each week to support TPM focused Production Area Based Team improvement activities such as Operator Equipment Management, or as the Japan Institute of Plant Maintenance call it – Autonomous Maintenance by Operators.
Commencing the TPM Journey
When a site commences the TPM journey we recommend starting with several Cross-functional Improvement Teams focused on the critical bottleneck lines. Each Cross-functional Team over a period of say 3 months, meeting weekly for one and a half hours, would first understand all the variables that could influence OEE then conduct detailed OEE Analysis using High Level OEE, Continuous Recorded Data from production sheets or monitoring system, and most importantly several OEE observations.
To understand about improvement issues we would then get the team to initiate sufficient improvements to lift OEE by say 10% – 20%. Once this gain has been achieved, we would then recommend establishing Production Area Based Teams and allocate say 5% of the gained OEE performance to stopping the line and allowing the crew to commence regular improvement activities to sort out their work area and then initiate Operator Equipment Management (Autonomous Maintenance by Operator) to find equipment defects at the earliest possible time. This along with further targeted Cross-functional Improvement Team activity, will take the line performance to best practice. OEE then becomes a key monitoring tool for all on the line or responsible for the line, to determine whether the Production Area Based Team TPM activities can be conducted each week.
Driver for Improvement
We have found OEE performance is very dependent on business needs. As such, a production line at one site might have a totally different OEE performance to an identical production line at another site, yet both production lines could be performing to ‘best practice’.
Let us explain this using just one of the 7 losses outlined in the Overall Equipment Effectiveness Model (this thinking can be applied to all the losses):
Set-up Downtime. This is normally defined as the time between last good output produced to the next required good output produced at the optimum or target speed. If you wish to compare OEE between lines then you need to ensure the lines being compared have exactly the same number of set-ups or changeovers and the same run lengths (amount produced between set-ups or batch size). Unless you have a dedicated line (no set-ups) that runs the same amount of time (e.g. 8 hours a day, 5 days a week so there is equal start-ups, etc.), then the OEE performance will be different no matter how good the crew is running the line.
Monitor for Formal Continuous Improvement
The definition for OEE should ensure that there is a 100% correlation to the good output produced from your line or plant. In other words, if OEE increases by 10% then you should be making 10% more good output or making the same amount of good output within 10% less time.
By having this 100% correlation, the OEE measure can be used to make decisions to support formal improvement time for Production Area Based Teams. By this we mean that if OEE performance drops then there is the risk that the required output for the week may not be achieved in which case, stopping the line for the weekly TPM activities such as Clean for Inspection to find equipment defects or sources for poor quality, may need to be deferred so that customer commitments are achieved.
If you shouldn’t Benchmark OEE, what should it be used for?
As mentioned earlier, OEE is an improvement driver. As such you need to determine what your target is for each of the 7 losses. This can also be broken down into sections of your line: e.g. filler, labeller, packer, palletiser, etc. The tool we have developed to assist this important process is the OEE Improvement Matrix which normally involves a 1st Level and 2nd Level Analysis of OEE.
The OEE Improvement Matrix has several purposes and is normally developed every 12 months for a line or plant to allow reflection on previous predictions, and map out the plan for the next 12 months supported by a 3 year target, recognising the need to address both technical and people related OEE losses.
Use of an OEE Improvement Matrix has a number of structured steps with the most important being the agreed assumptions behind each loss for best practice. For example at Coopers Brewery in Adelaide, South Australia they have been conducting an OEE Analysis on their bottling line each year for the past 10 years using the OEE Improvement Matrix where they have more than doubled their output. In 2008, they used the following assumptions for planned downtime and set-up downtime:
| Planned Downtime: | Allowed 2-hours per week per shift (2 shifts) for Operator Equipment Management activities during which Maintenance should be able to carry out most of their PMs etc, however remainder of maintenance will be carried out over No Production Required Time (most weekends). Line is also run continuously (e.g. no meal breaks allowed for due to relief to cover for the breaks) = 5% |
| Set-up Downtime: | 10 product changeovers per weekwith an allowance of 12 minutes per changeover = 2 hours per week = 2.5% |
The broad steps of creating an OEE Improvement Matrix can be broken up into:
- Establish previous 6 weeks OEE Baseline using High Level OEE equation;
- Conduct detailed OEE Analysis engaging all people in area to determine ‘as-is’ situation;
- Document assumptions based on business requirements and best practice for each loss (‘could-be’ in say 3 years once the TPM 7 steps of Operator Equipment Management / Autonomous Maintenance for Operator have been successfully completed);
- Develop ‘can-be’ one year targets;
- Identify and verify the causes of each loss and classify into Technical or People Development opportunities;
- Determine cost impact of each loss based on agreed assumptions; and
- Develop improvement action plan for next 12 months and link to 5 year Master Plan.
Once the assumptions are agreed, based on business requirements for each loss, then the gap between current performance ‘as-is’ and future performance ‘could-be’ can be identified. It is the ability to close the gap within an agreed timeframe that can be monitored and compared if necessary. We suggest the gap should be closed within 3 years with about 50% achieved within the first 12 months. It is how good this is being achieved that can be compared between sites irrespective of what the actual OEE figure is.
Technical versus People Development Related OEE Losses
Example: a spring breaks on a machine resulting in product being produced out of specification. Ideally the machine would stop immediately once the spring breaks and the product goes out of specification. In this case we have a technical problem (spring worn out or spring inappropriate for the work required) and can be addressed by the maintenance people or a small Cross-functional Team of say machine designer, production person regarding operation parameters, maintenance person regarding servicing etc.
However, we may have a different scenario. When the spring breaks the machine does not stop automatically (could be an old machine that has not had quality problem sensing installed) and you start producing off specification output. During a quality check the off spec output is identified and the search starts for the cause of the problem – it may take a while for the offending broken spring to be identified. This is an example of people losses – the time to identify the problem and its causes. The aim of TPM is to have operators who understand the functioning of their equipment (role of the spring) and an understanding of what conditions within their equipment could lead to quality problems (broken spring will result in a certain type of off spec output). Unless the technical solution of auto stopping when the spring breaks can be quickly and cheaply implemented, then the people loss will need to be addressed through Production Area Based Team TPM activities of Operator Equipment Management (or Autonomous Maintenance by Operators).
The Challenge of Productivity and OEE
OEE often does not take into account any changes in manning levels on a production line unless they are linked to the ideal speed, e.g. with 4 people we can produce X per hour whereas with 5 people we can produce X+Y per hour. Hence, depending on the manning levels, the Ideal Speed would change for calculating OEE.
We have seen many situations when OEE has been poor due to equipment or materials problems so extra people (often casuals) have been brought in to assist – however, there is no indication of this on the OEE performance charts.
Hence OEE should be linked to an agreed direct labour level, or Productivity (output per person hour) should be monitored in parallel with OEE performance – a practice rarely seen at sites or in benchmark studies.
Summary
OEE is a powerful improvement tool if used correctly. Too often, misguided managers go looking for the simple measure that they can focus-on so that they can compare performance. However, in reality, there is no one measure that tells the full story. A suite of performance measures which are aligned to your site’s Key Success Factors are required to capture all opportunities for improvement in an operation. To support the improvement of your suite of performance measures we have found OEE (plant & equipment focus) and Lead Time Reduction (process focus) are the drivers to improve, not measures to be compared.
By Ross Kennedy

Ross, who is based in Wollongong Australia, founded CTPM in 1996 after more than 20 years of manufacturing and operational experience covering maintenance, production, operations and executive roles along with 5 years of international consulting experience. Ross has been actively involved with Lean since 1985 and the application of TPM since 1990. In 1998 he developed and launched CTPM’s Australasian TPM & Lean methodology called TPM3. He is recognised as Australasia’s leading authority on TPM and TPM3. He is currently assisting sites throughout Australia, New Zealand, Indonesia and Thailand to strive for and achieve Operations Excellence.
For further information about Ross Kennedy visit www.ctpm.org.au or email: ross.kennedy@ctpm.org.au


