Moving to Flow
 Background
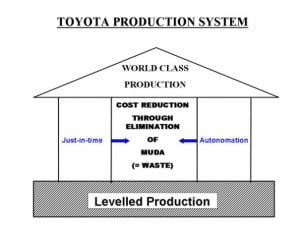
What is lean? The majority of people when asked this question reply “waste elimination”. This is true. However, Taiichi Ohno’s original definition of lean was “the complete and thorough elimination of waste to reduce the timeline from receipt of customer order to delivery”. To achieve this more complete definition necessitates the creation of product flow achieved through the implementation of leveled production. This is the foundation of the Toyota Production System, the origin of lean. Leveled production is an essential enabler for moving to flow and to becoming truly lean.
The Paradox
Why do so many companies focus on the waste elimination aspect of lean, while ignoring flow and levelled production? One reason is that when people come across terms like “every product every interval” and “one piece flow”, they seem impossible to apply in their business. In addition they think levelled production can only be achieved when there is stable demand – and who has that? Levelled production seems ridiculous for their business so it receives little further thought. On the other hand people easily understand eliminating waste; it is something they have been doing for years. Now value stream maps show them lots of new waste to work on, which enables them to say they are doing lean.
There is another reason, which is a lack of awareness and therefore understanding of how Toyota originated and progressively developed the implementation of production levelling. This helped them to achieve the final goal of one piece flow matched to market pull through Takt time. However, this was the final step in a 5-step process.
Establishing Production Levelling
How Toyota started the journey of levelling was to create a fixed production schedule that is rigidly followed. They called it “patterned production” and later the term became “heijunka”. It requires making the same products, in the same sequence, in the same volume, on the same equipment, at the same time, with the same sequence, every cycle. Which is where people start to say “But that’s impossible for our business!” Actually it’s not as difficult as people think, if you start with just the products that drive the majority of the volume and put those into a fixed cycle first.
As this fixed cycle schedule is repeated, a phenomenon I call “Economies of Repetition” soon starts to emerge. Essentially, it’s about going down the learning curve and establishing routines so that you can create standard work and continuous improvement. Quite simply, the more you do the same things in the same sequence, the better and more consistent you will naturally become. Economies of repetition is the magic that comes from fixed sequence schedules, which delivers above expected improvements in quality and productivity with less overheads and stocks. These gains in capability and capacity are significant enough to enable more products to be progressively introduced into the sequence, and to make the cycles faster, shorter and more flexible in order to progressively match volumes to actual market demands. The logical conclusion of this progression of levelling is “one piece flow matched to market pull through Takt time”.
A Tool to Help
A useful tool I have come to call the “Glenday Sieve” separates products (SKU’s) into four groups based on sales volume (or value if this is more appropriate). The results shown are typical. Many people insist that it is impossible for such a small percent of the product range to account for 50% of the sales volume in their business. Yet when the analysis is done, it is invariably found to be the case. These results are intuitive for some and genuinely shocking for others. Either way the power is in the indisputable information it provides.
Figure 1: Glenday Sieve Analysis
| Cumulative | Cumulative | Colour |
| % of Volume | % of SKU’s | Code |
50% | 6% | Green |
95% | 50% | Yellow |
99% | 70% | Blue |
Last 1% | 30% | Red |
It is not difficult to develop a fixed sequenced cycle for just 6% of the products, and then value stream mapping these items to help unravel the “spaghetti” pathways one usually finds through the plant. The end result is a “green stream” for these few high volume products, with shorter throughput times and continuous flow.
The “yellow” SKU’s are where to direct your capability improvement efforts, with exercises such as changeover reduction and smaller batch sizes so making it easier to introduce these products into the cycle. This typically results in a staggering 95% of the total volume yet only 50% of the product range now running in a fixed sequence “every product every cycle” schedule.
The “blue” SKU’s are typically 20% of the product range, but just 4% of sales. What opportunities are there for the harmonisation of raw materials and packaging so the final product appears different to customers but makes these SKU’s easier to include in the cycle? For instance, differently coloured bottles with the same shape, or labelled rather than printed cartons. These may sound like simple things but they can make a big difference in getting these products into the cycle and making them flow.
The “red” SKU’s will need to be carefully reviewed to determine their real business cost versus their benefit. The impact of these products to the total supply chain and overall company costs, including overheads, must be understood to be certain that the benefits of retailing them genuinely outweigh the costs. It is not uncommon for companies to recognise through this analysis that they actually have two distinct businesses. One is high volume with the same products, for which the plant, business processes and performance measurement systems were designed. The other is a low volume customised job shop operation, which is being managed through the same equipment, processes and systems for both “green” and “red” SKU’s, to the detriment of customer responsiveness and profit margins.
A further factor to consider
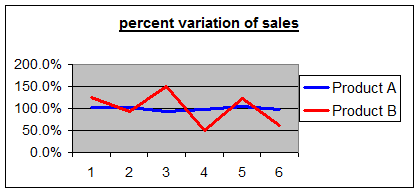
An understanding of the Central Limit Theory is also helpful in creating levelled production and flow, especially the impact on demand variability. Put simply, bigger sellers usually have less percentage variability than smaller sellers. This is because, in general, the sales of the bigger volume items are coming from a larger number of customers, so the variability in demand from individual customers is balanced out at the aggregate level. Correspondingly smaller sellers come from fewer customers so don’t have as much of this balancing out, resulting in higher percentage variability.
Ironically, because people generally measure production and sales at the unit level, not percentage, many consider the bigger sellers to have the greatest variability because the volume changes are large – see table below. Whereas it is typically the smaller sellers that trigger short term plan changes and fire fighting, which then affects the production efficiency of the larger volume items. The figures shown are for actual sales over a six week period for a well-known brand of yogurt, comparing two products with very different sales volumes.
|
| PRODUCT A |
|
| PRODUCT B |
|
| actual | volume | percent | actual | volume | percent |
Week | sales | variation | variation | sales | variation | variation |
1 | 15745 | 472 | 103% | 345 | 70 | 126% |
2 | 15785 | 512 | 103% | 256 | – 19 | 93% |
3 | 14230 | -1043 | 93% | 410 | 135 | 149% |
4 | 14896 | – 377 | 97% | 137 | -138 | 50% |
5 | 16005 | 732 | 105% | 335 | 60 | 122% |
6 | 14975 | – 298 | 98% | 167 | -108 | 61% |
Average | 15273 |
|
| 275 |
|
|
This is more easily seen when comparing the percent variability data in a graph, as shown below.

This raises two points to consider:
1) With their higher level of demand variability, what is the real cost impact on the business of the “red” SKU’s?
2) With the higher percentage stability of demand for the “green” SKU’s how difficult is it in reality to create levelled production and fixed schedules for these items?
Conclusion
Implementing levelled production to help achieve moving to flow may not be as impossible or ridiculous as many people seem to think. Is it not worth a little more consideration? What indisputable information would the “Glenday Sieve” reveal for your company?
It is the origin and foundation of the Toyota Production System, though probably the least understood aspect of TPS. I have had many discussions with John Shook, CEO of Lean Enterprise Institute USA and previously the first American to work as a regular employee in Toyota’s Global manufacturing headquarters in Toyota City in Japan. Here is a quote from one of John’s emails to me:
“What is remarkable is that so few companies or people have arrived at this understanding of heijunka. I have stumbled across no-one, until you, who discovered this on their own. I think, as you suggest, more people should be able to understand these concepts.”
By Ian Glenday
 Ian divides his time between working with Professor Dan Jones at the Lean Enterprise Academy, UK, where he is a Senior Fellow, and helping businesses around the world make their own Lean transformations through his company Repetitive flexible Supply Ltd.
Author of “Breaking though to flow” which was awarded the Shingo Research and Professional Publication Award in 2010. Co-authored with Rick Sather V-P Customer Supply Chain Kimberly-Clark North America Consumer Products “Lean RFS: Putting the pieces together” published by Productivity Press May 2013.
Contact him at ian@rfsweb.com
Further reading on this topic:
“Lean RFS: putting the pieces together” by Ian Glenday & Rick Sather published by Productivity Press May 2013. Available at www.crcpress.com/product/isbn/9781466578197 and Amazon.
“This book is the missing link in many Lean journeys” Professor Dan T. Jones.


